My Dashboard is the starting point of Nafhaa Application where you view tons of data aggregated from various modules. It lists various important alerts which needs attention from the employees. Contains beautiful charts which shows the relevant data from the specific modules.
Now lets see what we have on our dashboard. Please note, the block shown here are for demo purpose only. Actual blocks may vary based on the modules you have selected, availability of data, viewing permissions, etc. are few to name but there is could be many other factors affecting the visibility of the blocks.
We will see block by block.
Counter Block
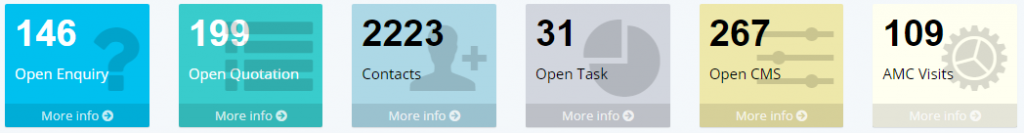
The top most block of dashboard is counter block which display the aggregate counts of Enquiries, Quotation, Contacts, Task, CMS and Visits. The count and visibility of blocks will vary based on data and module availability. So you may see at times 2-3 block or you may all the blocks.
Chart Block
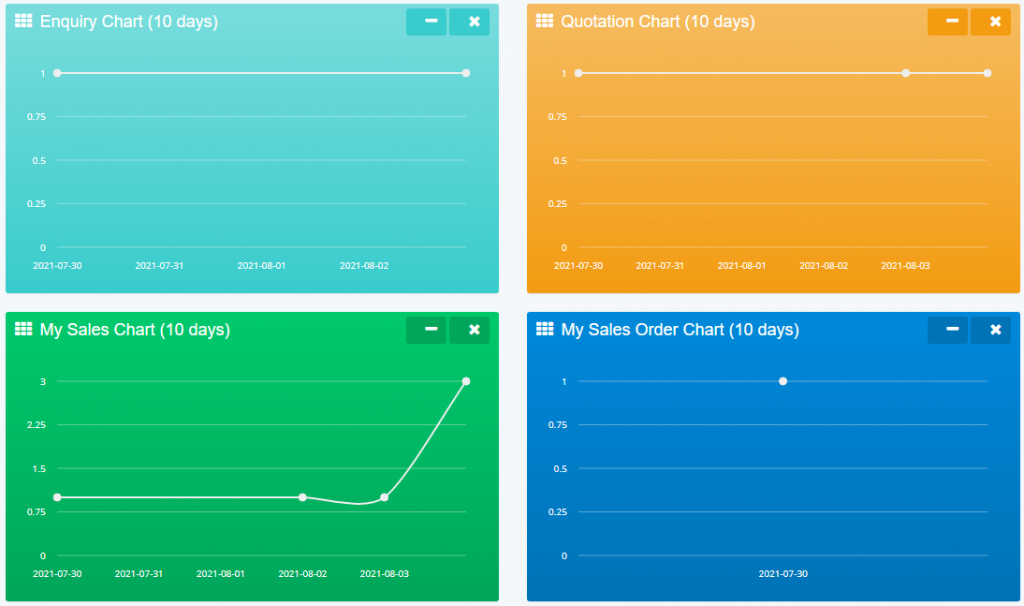
This is the graphical block which will display the counts in the form of Line charts, even these block are dynamic and will displayed only when the data is available. These charts are self-adjustable block which means, if a certain chart is not available to display data, then the subsequent chart will occupy the remaining space and when once the data is available for display the new chart will adjust the space and then display.
Target and Achievement Block
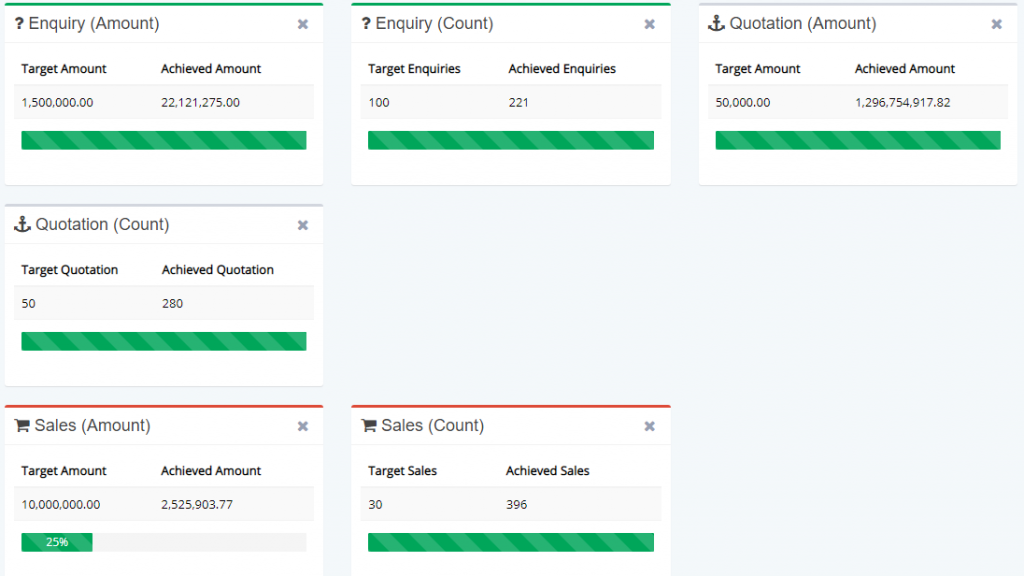
This block will display the progress happened wrt Target set by the organization. Also this will help the executives to focus on targets which are achievable and which will need additional push to achieve the same. Targets can be set using Target configuration module here.
Alerts
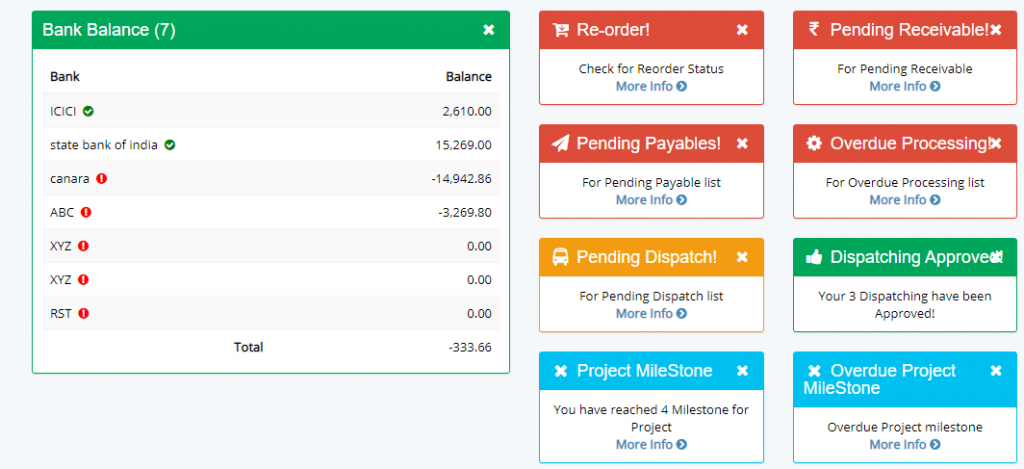
Alert section will display various alerts based on the conditions and settings enabled by the admins. Some alerts displayed here are user specific which means, a user who has permission will be able to view the alert and then act upon it. Even some alerts shown here are business specific and wont be available to all the users using portal.
Bank Balance section, will display the amount that is available across the Bank accounts which provides the user and executive an insight about the funds. This is a permissions based section which mean users having permission will be able to view the data.
Tabular Data Notifications
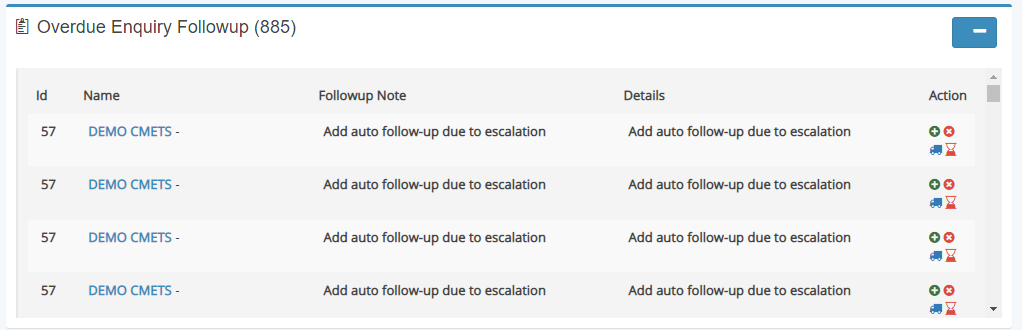
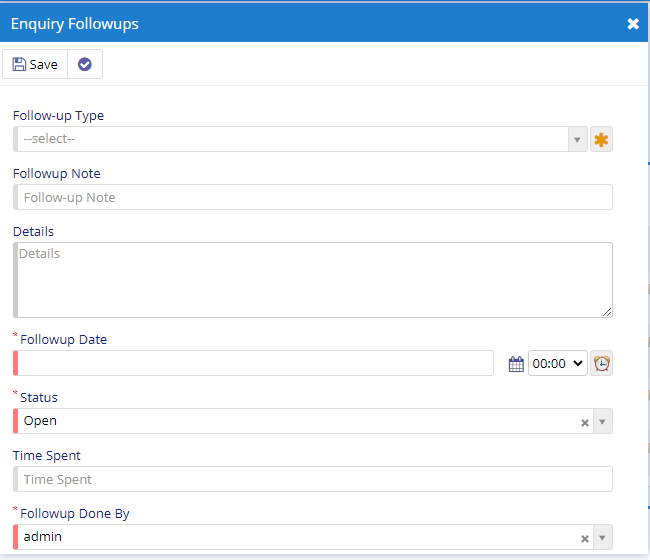
Dashboard also includes the notification or alerts in the form of Table containing vital updates that needs to handled. Apart from this the user will be able to perform actions directly from the table itself. The action column has all the options available. User will be able to update the status using the buttons given under the Action column. When the user click add new button it will invoke dialog or window for adding new data. An example is shown below.
So this sums up the Main or My Dashboard.